Note
Go to the end to download the full example code.
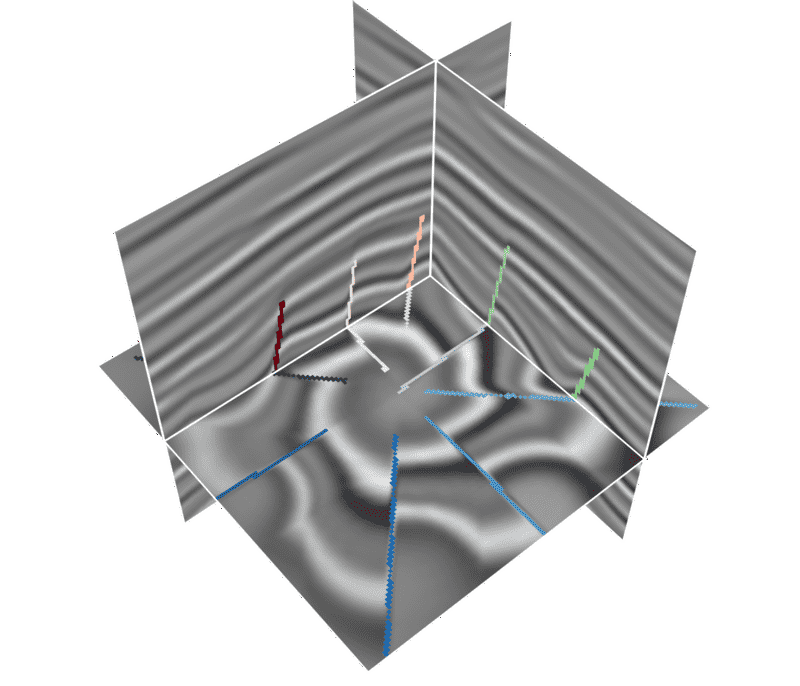
Overlay faults with different colors on x/y/z slices#
When the same fault volume is overlaid on several seismic slices, each slice
orientation can use a different colormap. Pass a dictionary to add_mask:
'x' controls inline slices, 'y' controls crossline slices, and 'z'
controls time/depth slices.
# sphinx_gallery_thumbnail_path = '_static/cigvis/3Dvispy/02b.png'


import numpy as np
import cigvis
from pathlib import Path

root = Path(__file__).resolve().parent.parent.parent

sxp = root / 'data/rgt/sx.dat'
fxp = root / 'data/rgt/fx.dat'
ni, nx, nt = 128, 128, 128

sx = np.fromfile(sxp, np.float32).reshape(ni, nx, nt)
fx = np.fromfile(fxp, np.float32).reshape(ni, nx, nt)

nodes = cigvis.create_slices(sx, pos=[[36], [28], [84]], cmap='gray')

# Use one fault mask, but color it by the orientation of the slice plane.
fault_cmaps = {
    'x': 'Reds',    # inline slice
    'y': 'Greens',  # crossline slice
    'z': 'Blues',   # time/depth slice
}
nodes = cigvis.add_mask(
    nodes,
    fx,
    cmap=fault_cmaps,
    interpolation='nearest',
    alpha=1,
    excpt='min',
)

cigvis.plot3D(
    nodes,
    view=cigvis.Plot3DView(size=(700, 600)),
    save=cigvis.Plot3DSave(path='example.png'),
)