Note
Go to the end to download the full example code.
Display a 3D volume of data in web browser using viserplot#
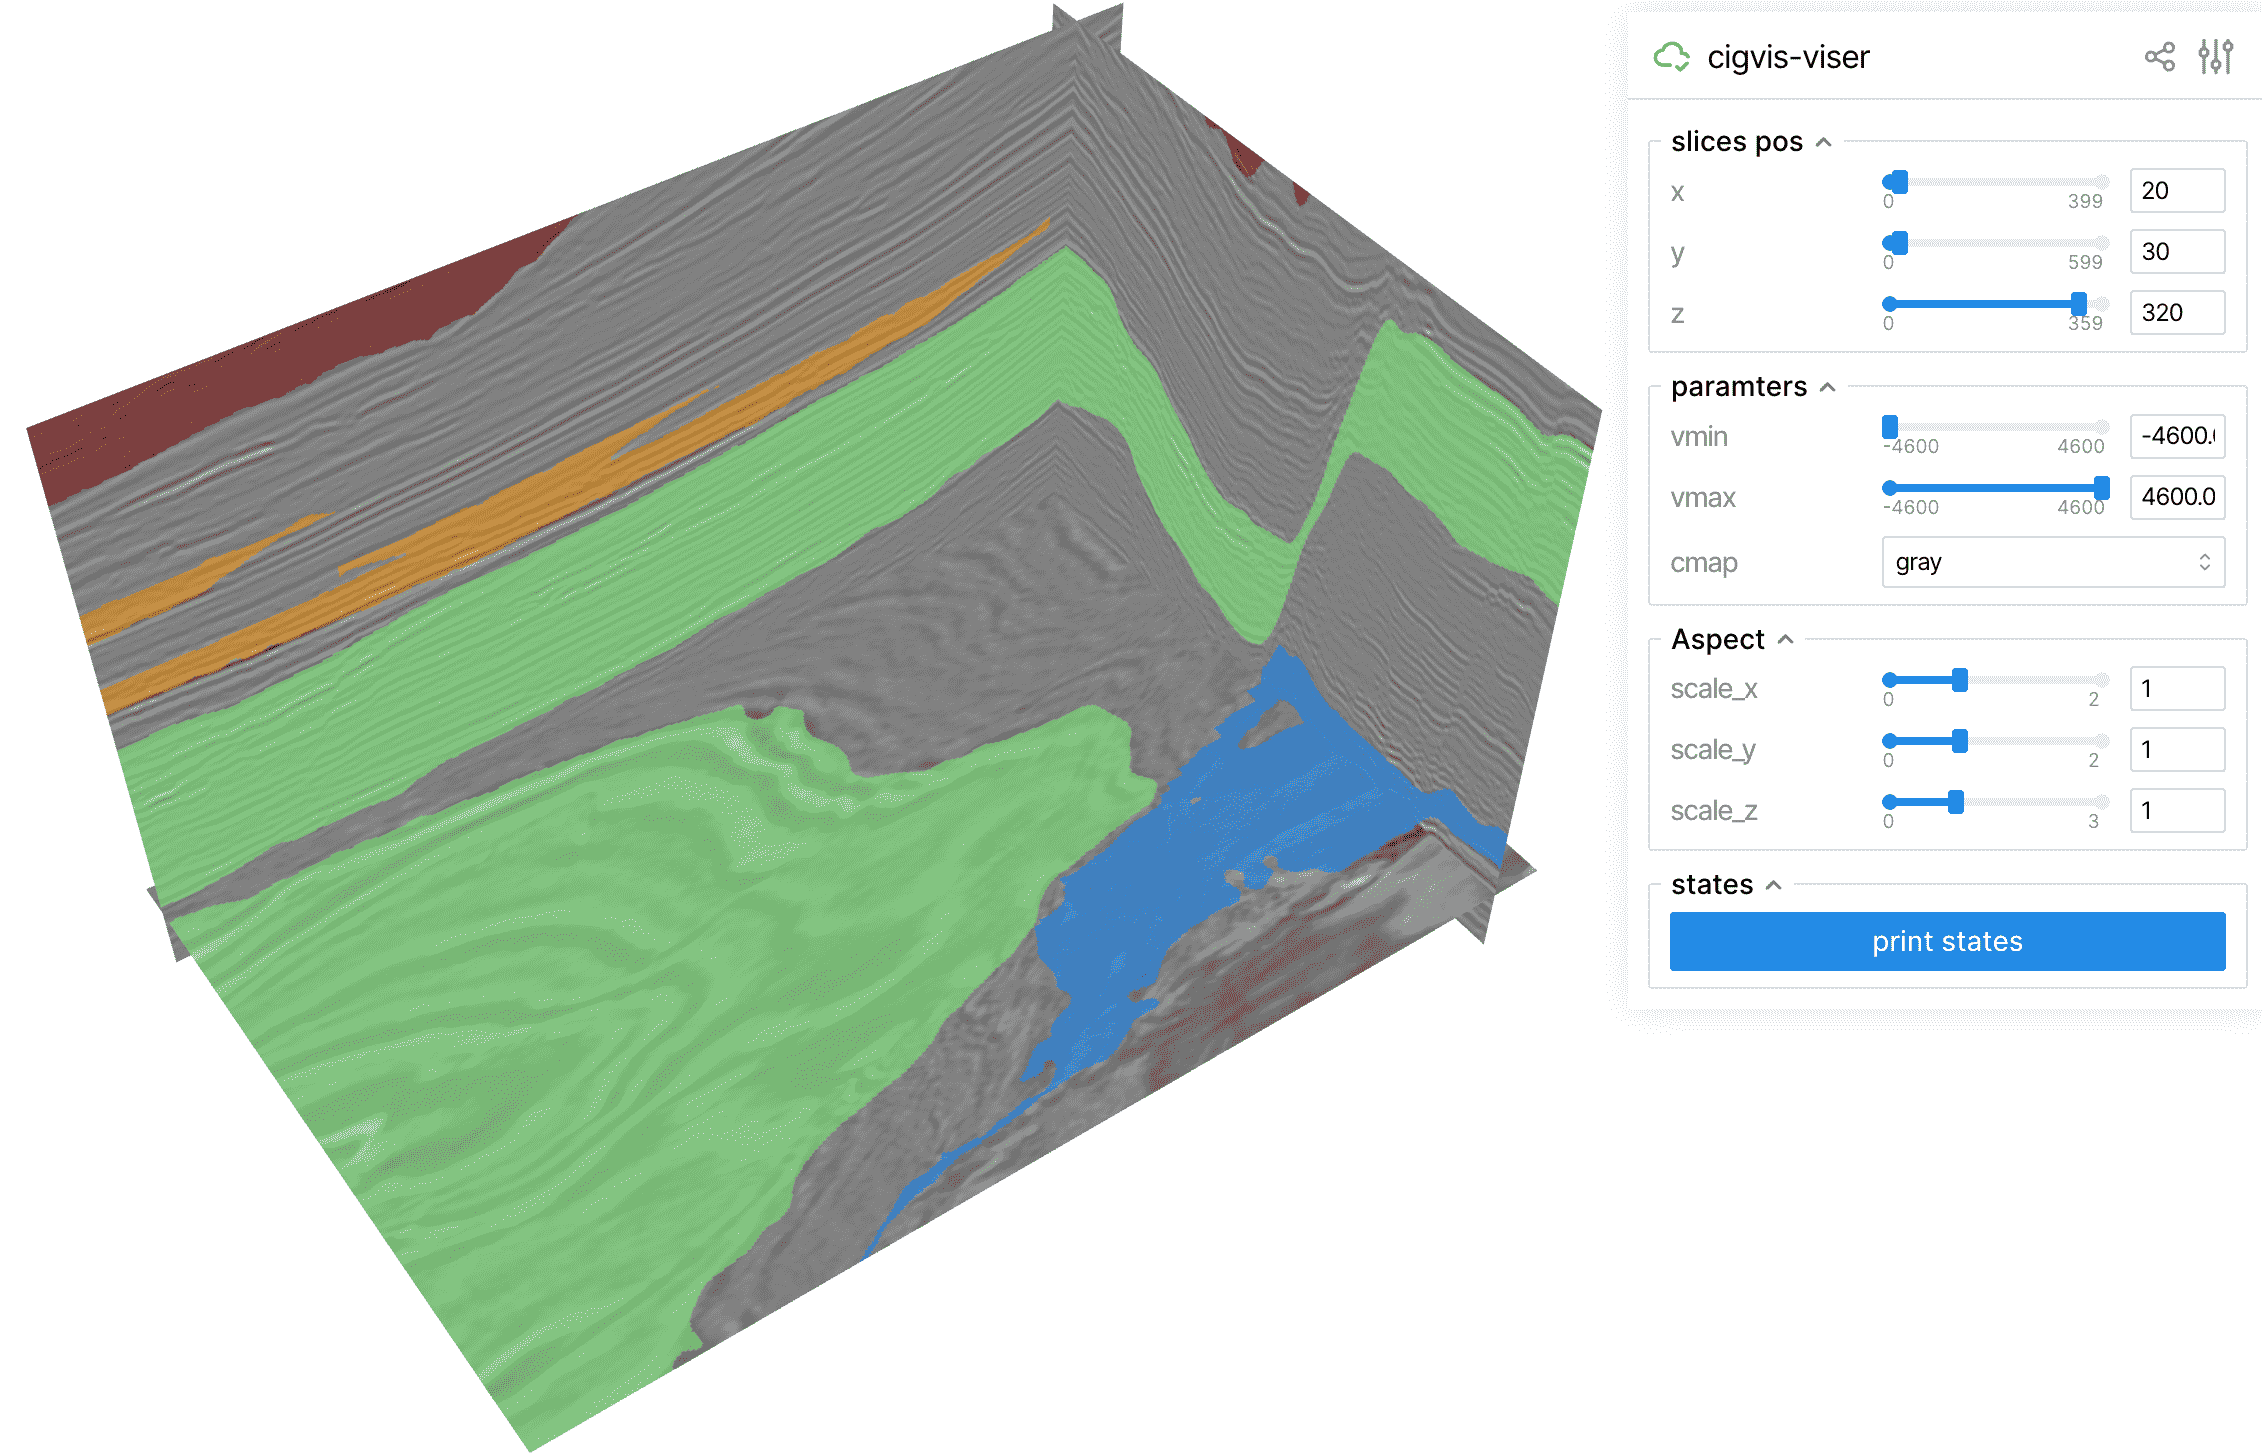
# sphinx_gallery_thumbnail_path = '_static/cigvis/viser/01.png'


import numpy as np
from cigvis import colormap, viserplot

ni, nx, nt = 400, 600, 360
shape = (ni, nx, nt)
data = np.fromfile('data/seis_h360x600x400.dat', dtype=np.float32).reshape(shape)
label = np.fromfile('data/label_h360x600x400.dat', dtype=np.float32).reshape(shape)
nodes = viserplot.create_slices(data, pos=[20, 30, 320], cmap='gray')

cmap = colormap.set_alpha_except_min('jet', 0.5)

nodes = viserplot.add_mask(nodes, label, cmap=cmap)

viserplot.plot3D(nodes)