Note
Go to the end to download the full example code.
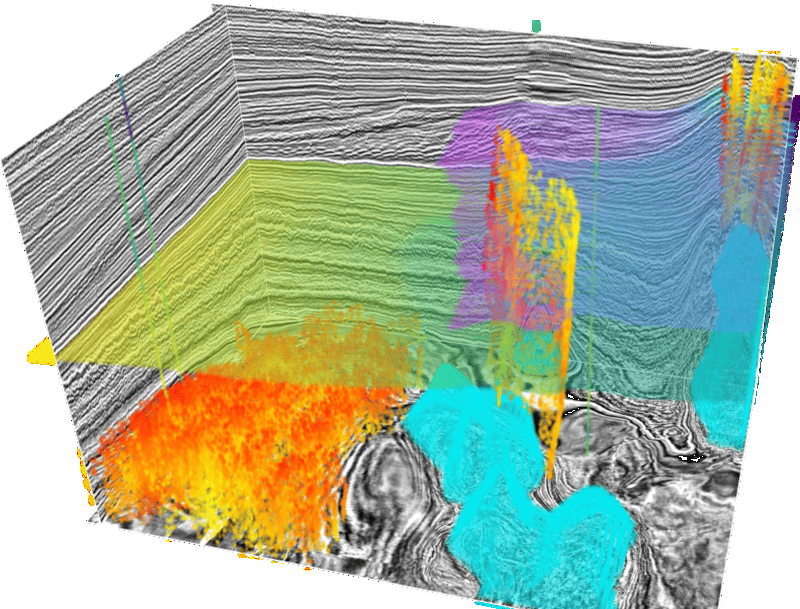
True Gaussian splats on the F3 demo#
Use Viser’s experimental add_gaussian_splats primitive. Unlike
06_splats.py, each sample has a 3D covariance and opacity.
# sphinx_gallery_thumbnail_path = '_static/cigvis/viser/07.png'


from pathlib import Path

import numpy as np
from scipy.ndimage import binary_erosion

from cigvis import viserplot
from cigvis.io import load_skins


def _extend(nodes, new_nodes):
    if new_nodes:
        nodes.extend(new_nodes)


def salt_body_gaussians(salt, step=(5, 7, 4), max_points=22000):
    sample = np.asarray(salt[::step[0], ::step[1], ::step[2]]) > 0.0
    if not np.any(sample):
        return []

    eroded = binary_erosion(
        sample,
        structure=np.ones((3, 3, 3), dtype=bool),
        border_value=0,
    )
    boundary = sample & ~eroded
    pos = np.argwhere(boundary).astype(np.float32)
    pos *= np.asarray(step, dtype=np.float32)

    return viserplot.create_gaussian_splats(
        pos,
        mode='volume',
        color=(0.0, 0.92, 0.95),
        radius=2.2,
        opacity=0.34,
        max_points=max_points,
        seed=21,
    )


def surface_gaussians(surface,
                      zmax,
                      step=10,
                      cmap='viridis',
                      opacity=0.42,
                      max_points=42000):
    ii = np.arange(0, surface.shape[0], step, dtype=np.float32)
    jj = np.arange(0, surface.shape[1], step, dtype=np.float32)
    grid_i, grid_j = np.meshgrid(ii, jj, indexing='ij')
    depth = np.asarray(surface[np.ix_(ii.astype(int), jj.astype(int))],
                       dtype=np.float32)

    valid = np.isfinite(depth) & (depth > 0.0) & (depth < zmax * 1.2)
    if not np.any(valid):
        return []

    pos = np.column_stack([grid_i[valid], grid_j[valid], depth[valid]])
    return viserplot.create_gaussian_splats(
        pos.astype(np.float32),
        values=depth[valid],
        mode='surface',
        cmap=cmap,
        radius=(5.0, 5.0, 0.75),
        opacity=opacity,
        max_points=max_points,
        seed=23,
    )


def fault_skin_gaussians(skin_dir, max_points=26000):
    vertices, _faces, likelihood = load_skins(str(skin_dir),
                                              endian='>',
                                              values_type='likelihood')
    return viserplot.create_gaussian_splats(
        vertices.astype(np.float32, copy=False),
        values=likelihood.astype(np.float32, copy=False),
        mode='surface',
        cmap='autumn',
        radius=1.7,
        opacity=0.55,
        max_points=max_points,
        seed=27,
    )


def well_log_gaussians(log_path, zmax, sample_step=14):
    nlog = 4
    npoints = 2121
    x = np.asarray([259, 619, 339, 141], dtype=np.float32)
    y = np.asarray([33, 545, 704, 84], dtype=np.float32)
    z = np.arange(0, 0.2 * npoints, 0.2, dtype=np.float32)

    raw = np.fromfile(log_path, np.float32).reshape(nlog, npoints)
    with np.errstate(divide='ignore', invalid='ignore'):
        values = 0.5 * np.log(raw)

    all_pos = []
    all_values = []
    for i in range(nlog):
        valid = np.isfinite(values[i]) & (raw[i] > 0.0) & (z < zmax * 1.2)
        valid_idx = np.flatnonzero(valid)[::sample_step]
        if valid_idx.size == 0:
            continue
        all_pos.append(
            np.column_stack([
                np.full(valid_idx.size, x[i], dtype=np.float32),
                np.full(valid_idx.size, y[i], dtype=np.float32),
                z[valid_idx],
            ]))
        all_values.append(values[i, valid_idx])

    if not all_pos:
        return []

    pos = np.concatenate(all_pos).astype(np.float32)
    values = np.concatenate(all_values).astype(np.float32)
    return viserplot.create_gaussian_splats(
        pos,
        values=values,
        mode='point',
        cmap='viridis',
        radius=1.5,
        opacity=0.72,
    )


def pick_gaussians():
    pos = np.asarray([
        [192, 634.1855, 32.3816],
        [192, 616.5631, 139.5132],
        [192, 600.3925, 220.0604],
    ], dtype=np.float32)
    return viserplot.create_gaussian_splats(
        pos,
        mode='point',
        color=(0.0, 0.95, 1.0),
        radius=3.0,
        opacity=0.9,
    )


root = Path('/Volumes/T7/DATA/cigvisdata/F3/')
seisp = root / 'seis.dat'
saltp = root / 'salt.dat'
hz2p = root / 'hz.dat'
unc2p = root / 'unc2.dat'
logp = root / 'logs.dat'
skin_dir = root / 'skins'

ni, nx, nt = 591, 951, 362
shape = (ni, nx, nt)

seis = np.memmap(seisp, np.float32, 'c', shape=shape)
nodes = viserplot.create_slices(
    seis,
    pos=[ni - 2, 25, nt - 2],
    cmap='gray',
    clim=[-2.0, 1.5],
)

salt = np.memmap(saltp, np.float32, 'c', shape=shape)
_extend(nodes, salt_body_gaussians(salt))

hz2 = np.fromfile(hz2p, np.float32).reshape(ni, nx)
_extend(nodes, surface_gaussians(hz2, nt, step=10, cmap='viridis'))

unc2 = np.fromfile(unc2p, np.float32).reshape(ni, nx)
_extend(nodes, surface_gaussians(unc2, nt, step=12, cmap='cool', opacity=0.38))

_extend(nodes, fault_skin_gaussians(skin_dir))
_extend(nodes, well_log_gaussians(logp, nt))
_extend(nodes, pick_gaussians())

viserplot.plot3D(nodes,
                axis_scales=(1.0, 1.0, 1.7),
                fov=30.0,
                look_at=[0.328201, 1.022802, 0.363886],
                wxyz=[0.695484, 0.377461, 0.291647, 0.537371],
                position=[-1.709967, 1.554335, -1.005026],
                )