Note
Go to the end to download the full example code.
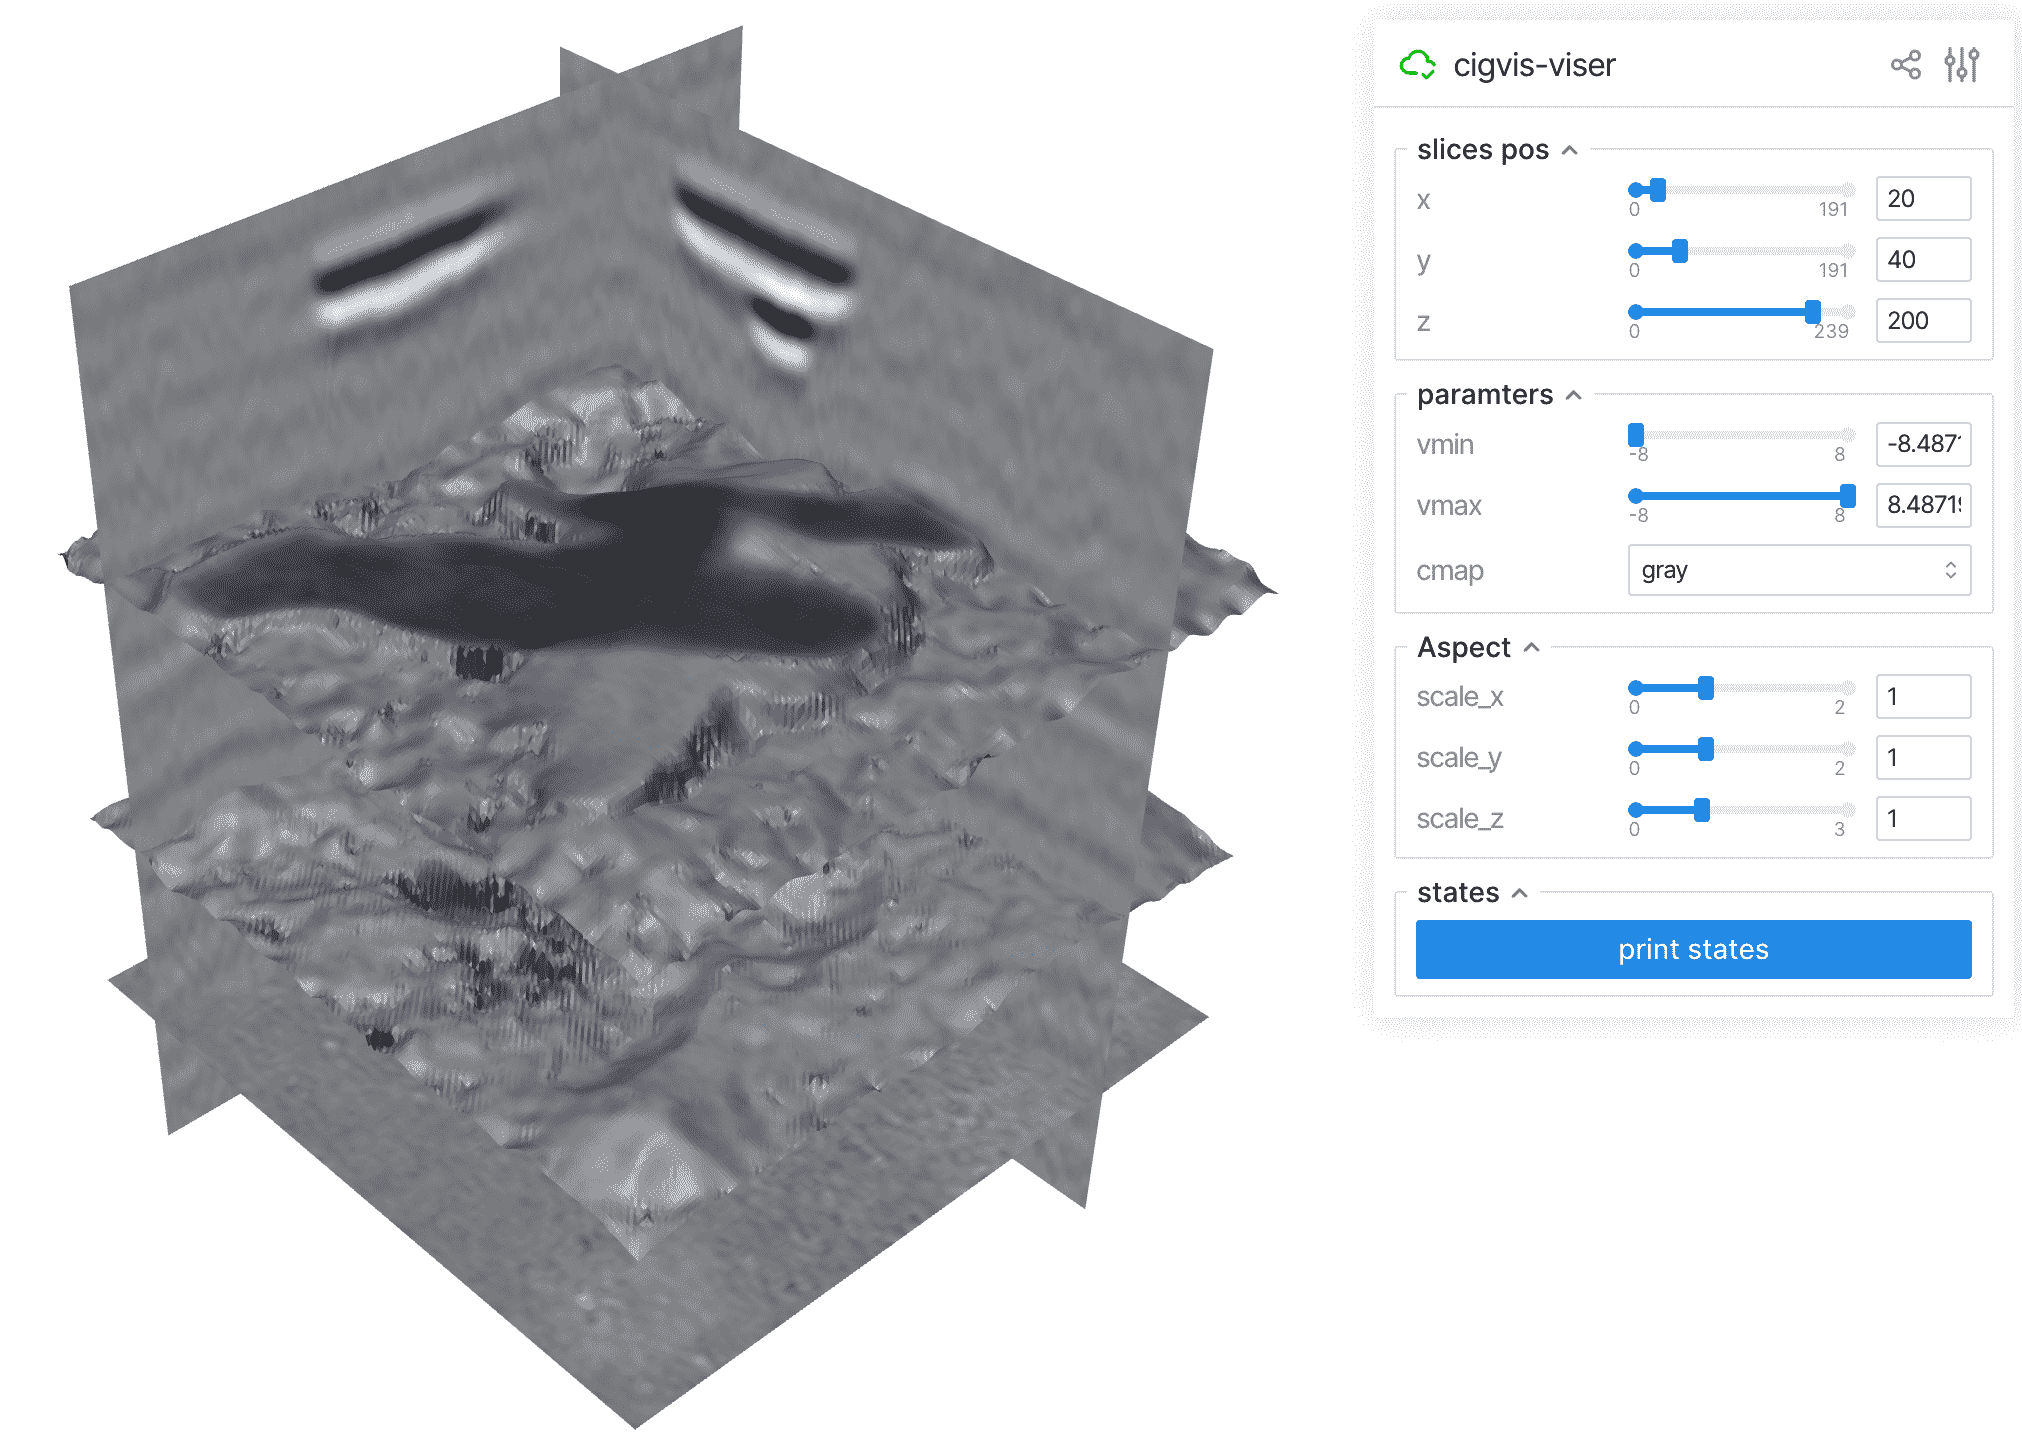
Display a 3D volume and two surfaces in web browser#
# sphinx_gallery_thumbnail_path = '_static/cigvis/viser/02.png'


import numpy as np
from cigvis import viserplot

sxp = 'data/co2/sx.dat'
sfp1 = 'data/co2/mh21.dat'
sfp2 = 'data/co2/mh22.dat'
ni, nx, nt = 192, 192, 240

sx = np.fromfile(sxp, np.float32).reshape(ni, nx, nt)
sf1 = np.fromfile(sfp1, np.float32).reshape(ni, nx)
sf2 = np.fromfile(sfp2, np.float32).reshape(ni, nx)

nodes = viserplot.create_slices(sx, pos=[20, 40, 200], cmap='gray')

# show amplitude
nodes += viserplot.create_surfaces(
    [sf1, sf2],
    volume=sx,
    value_type='amp',
    cmap='seismic',
    clim=[-3, 3],
)


viserplot.plot3D(nodes)