Note
Go to the end to download the full example code.
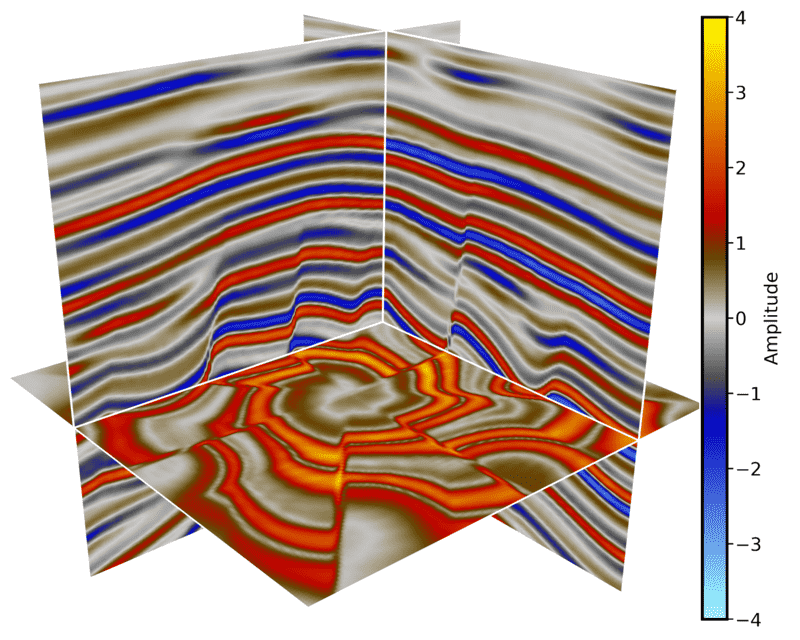
Use different volume sources for different slice directions#
create_slices accepts an axis source dictionary. This is useful for large
volumes when the best storage layout differs by slice direction, for example a
binary memmap for inline slices and zarr/lazy arrays for crossline and time
slices. Each source must expose the same logical 3D shape. If a source is
stored in another physical axis order, wrap it as
{'data': source, 'axes': ('z', 'y', 'x')}.
The demo keeps the data self-contained by wrapping one memmap with two lazy
sources. The wrappers make the y and z slices visibly different, and they only
transform the slice that is requested. In a real project, replace any value in
axis_sources with another numpy-like source, such as a zarr array. The z
source below uses a transposed view only to demonstrate the axis-order API; in
practice this can be a separate on-disk source stored as (nt, nx, ni).
# sphinx_gallery_thumbnail_path = '_static/cigvis/3Dvispy/16.png'


import numpy as np
import cigvis
from pathlib import Path


root = Path(__file__).resolve().parent.parent.parent

sxp = root / 'data/rgt/sx.dat'
ni, nx, nt = 128, 128, 128
shape = (ni, nx, nt)


class LazyTransformedVolume:
    def __init__(self, source, transform):
        self.source = source
        self.transform = transform
        self.shape = source.shape
        self.ndim = source.ndim

    def __getitem__(self, key):
        return self.transform(np.asarray(self.source[key], dtype=np.float32))


seismic = np.memmap(sxp, np.float32, 'r', shape=shape)
seismic_zyx = np.transpose(seismic, (2, 1, 0))

axis_sources = {
    # Inline slices use the original seismic memmap.
    'x': seismic,
    # Crossline slices use a second source with reversed polarity.
    'y': LazyTransformedVolume(seismic, lambda x: -x),
    # Time/depth slices use a source declared as physical (z, y, x).
    'z': {
        'data': LazyTransformedVolume(seismic_zyx, np.abs),
        'axes': ('z', 'y', 'x'),
    },
}

nodes = cigvis.create_slices(
    axis_sources,
    pos={'x': [36], 'y': [28], 'z': [84]},
    cmap='Petrel',
    clim=[-4, 4],
)
nodes += cigvis.create_colorbar_from_nodes(nodes, 'Amplitude', select='slices')

cigvis.plot3D(
    nodes,
    view=cigvis.Plot3DView(size=(750, 600)),
    save=cigvis.Plot3DSave(path='example.png', transparent_bg=False),
)