Note
Go to the end to download the full example code.
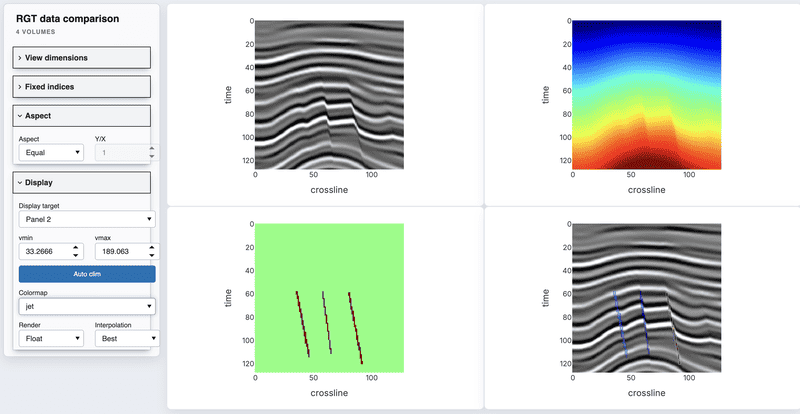
Real data comparison grid#
Compare seismic, RGT, and fault volumes with shared dimension/index controls.
# sphinx_gallery_thumbnail_path = '_static/cigvis/sliceviewer/02.png'


from pathlib import Path

import numpy as np

from cigvis import sliceviewer as sv


ROOT = Path(__file__).resolve().parents[2]
DATA = ROOT / "data" / "rgt"
SHAPE = (128, 128, 128)
INLINE = 40

seismic = np.fromfile(DATA / "sx.dat", np.float32).reshape(SHAPE)
rgt = np.fromfile(DATA / "ux.dat", np.float32).reshape(SHAPE)
fault = np.fromfile(DATA / "fx.dat", np.float32).reshape(SHAPE)

axis_labels = ("inline", "crossline", "time")
slice_kwargs = dict(
    display_axes=(2, 1),
    indices={0: INLINE},
    axis_labels=axis_labels,
    interpolation="nearest",
    render_mode="float",
)

nodes_seismic = sv.create_slice(seismic, cmap="gray", **slice_kwargs)
nodes_rgt = sv.create_slice(rgt, cmap="jet", **slice_kwargs)
nodes_fault = sv.create_slice(fault, cmap="jet", **slice_kwargs)
nodes_overlay = sv.create_slice(seismic, cmap="gray", **slice_kwargs)
nodes_overlay = sv.add_mask(nodes_overlay, fault, cmap="jet", alpha=0.45, excpt="min")


if __name__ == "__main__":
    sv.show(
        [nodes_seismic, nodes_rgt, nodes_fault, nodes_overlay],
        grid=(2, 2),
        port=5007,
        title="RGT data comparison",
        plot_height=340,
    )