3D vispy#
00-select_vispy_backend.py shows how to inspect or choose the VisPy
application backend before importing cigvis. Use pyside6 when calling
plot3D(..., gui=True) because the GUI inspector is a PySide6 Qt window.
The fault overlay examples include 02b-overlay_fault_axis_colors.py, which
shows how to pass a cmap dictionary to add_mask so faults on x/y/z slice
planes use different colors.
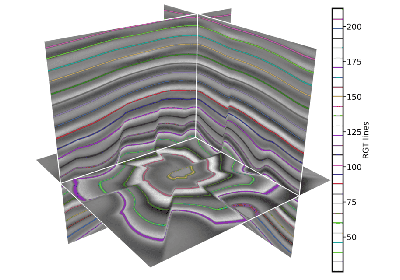
The RGT overlay examples include 03b-overlay_rgt_line_cmap.py, which uses
colormap.line_cmap to show sparse RGT horizon lines directly on slices
without extracting contour geometry first.
05b-surface_quad_patches.py shows how to render sparse or incomplete gentle
horizon points as independent quad patches with create_surfaces(...,
quad=True).
16-multi_volume_sources.py shows how to pass an axis source dictionary to
create_slices so x/y/z slice directions can read from different
numpy-like volume sources.
18-display_range.py shows how to use display_range to hide unused
time/depth samples and avoid reading that hidden part from lazy slice sources.
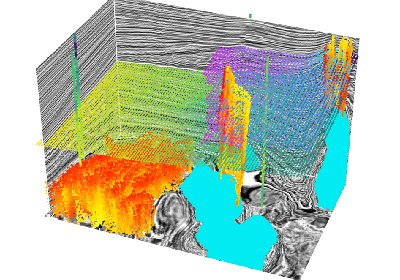
19-point_cloud.py uses VisPy’s native Markers visual to show the F3
interpretation objects in a point-cloud style similar to the Viser point-cloud
demo.


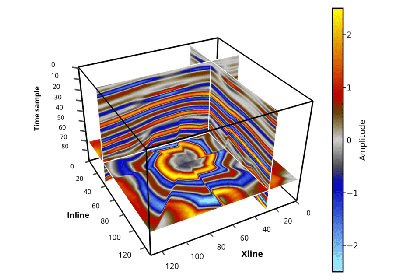
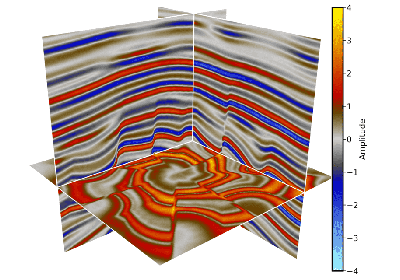
Display a 3D volume of data (by selecting several slices)

Overlaying fault displays on slices of 3D seismic data bodies
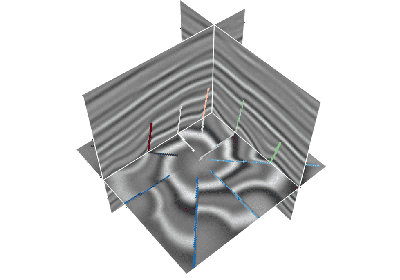
Overlay faults with different colors on x/y/z slices

Overlay RGT display on slice of 3D seismic data volume

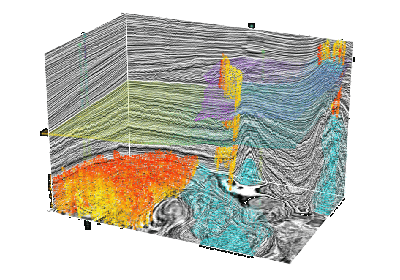
Overlay multiple 3D data bodies (RGT, fault) on slices of 3D seismic data bodies


Display 3D seismic data and 3D geological bodies (CO2)


The log track is displayed as a tube and multiple log curves are displayed


Divide multiple canvas to display multiple 3D data


Use different volume sources for different slice directions