Note
Go to the end to download the full example code.
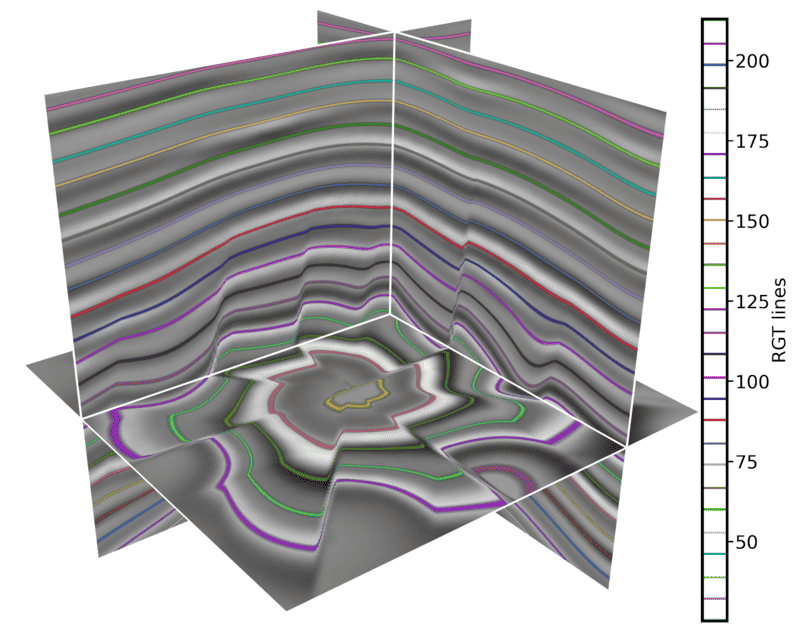
Overlay RGT horizon lines using line_cmap#
colormap.line_cmap turns a regular colormap into sparse opaque color
samples on a transparent background. For RGT volumes, this makes selected RGT
levels appear as colored horizon lines on seismic slices, without explicitly
extracting contours or horizons.
# sphinx_gallery_thumbnail_path = '_static/cigvis/3Dvispy/03b.png'


import numpy as np
import cigvis
from cigvis import colormap
from pathlib import Path

root = Path(__file__).resolve().parent.parent.parent

sxp = root / 'data/rgt/sx.dat'
uxp = root / 'data/rgt/ux.dat'
ni, nx, nt = 128, 128, 128

sx = np.fromfile(sxp, np.float32).reshape(ni, nx, nt)
rgt = np.fromfile(uxp, np.float32).reshape(ni, nx, nt)

nodes = cigvis.create_slices(sx, pos=[[36], [28], [84]], cmap='gray')

# n_lines controls how many RGT levels are highlighted. samples controls the
# lookup-table resolution; larger samples usually make the lines thinner.
rgt_lines = colormap.line_cmap(n_lines=28, samples=256)
nodes = cigvis.add_mask(
    nodes,
    rgt,
    cmap=rgt_lines,
)

nodes += cigvis.create_colorbar_from_nodes(
    nodes,
    'RGT lines',
    select='mask',
    preserve_alpha=True,
)

cigvis.plot3D(
    nodes,
    view=cigvis.Plot3DView(size=(750, 600)),
    save=cigvis.Plot3DSave(path='example.png'),
)